hledger and Ultorg
Ultorg provides a slick visual UI for relational data. It is an easy and powerful way to visualise and analyse your hledger data in a tabular GUI.
Ultorg goes farther than spreadsheets, with more powerful joins and layout. https://www.ultorg.com/resources > 1st video demonstrates its key features, and the 3rd video is a fascinating demo of analysing Quickbooks data.
Exporting to Ultorg via CSV
This method is perhaps the easiest.
-
Export a hledger journal as CSV, eg:
$ hledger -f examples/bcexample.hledger print -o examples/bcexample.csvor
$ hledger print -o main.csv -
Run Ultorg.
-
Click Add Data Source in the left panel, click Connect to File, and select the CSV file. Press enter to confirm the import settings.
-
The CSV file appears in the left panel, containing one table. Double-click on the table to open it in the main pane.
-
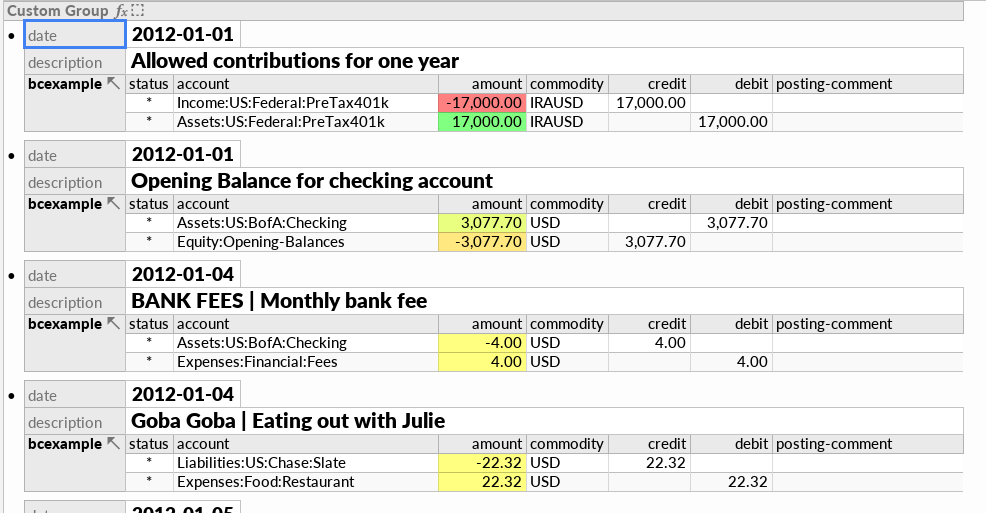
Group all the per-transaction columns: CMD/CTRL-click the headings of txnidx, date, status, and description, right-click the headings and choose Custom Group (CMD-I).
-
Now hide uninteresting columns, eg perhaps Row Number, status: CMD/CTRL-click the headings, right-click -> Hide (CMD-SHIFT-K). (Don't hide txnidx, it seems to help date sorting.)
-
And sort by date: right-click date heading, Sort Ascending.
Exporting to Ultorg via SQlite
The results are much the same as the above, though you will also have an SQLite database to play with (see hledger and SQLite). This method requires Ultorg >=1.26. Note also ultorg#53.
-
Export a hledger journal as an Sqlite database. Eg:
$ hledger -f examples/bcexample.hledger print -O sql | sqlite3 bcexample.dbor
$ hledger print -O sql | sqlite3 main.db -
Run Ultorg.
-
Click Add Data Source in the left panel, click Connect to File, and select the .db file.
-
The db file appears in the left panel, containing one table. Double-click on the table (Postings) to open it in the main pane.
-
Group all the per-transaction columns: CMD/CTRL-click the headings of Txnidx, Date 1, Date 2, Status, Code, Description and Comment, right-click the headings and choose Custom Group (CMD-I).
-
Now hide uninteresting columns, eg perhaps Date2, Status, Code, ID, Posting Status: CMD/CTRL-click their headings, right-click -> Hide (CMD-SHIFT-K). (Don't hide Txnidx, it seems to help date sorting.)
-
And sort by date: right-click Date 1 heading, Sort Ascending.
Things to try
-
Click the Amount column, then click the toolbar button that (by default) looks like a bar chart.
-
Click the toolbar button that (by default) looks like a table and select a different Auto-Layout Type, like Form (Multi-Column).

